Analyzing the data provided within GoSite's Sites tool including page views, total sessions, avg. session duration, and bounces
GoSite's Sites tool is constantly gathering data to help you understand your website's performance. This article will help you understand all of the website statistics displayed within your Sites tool.
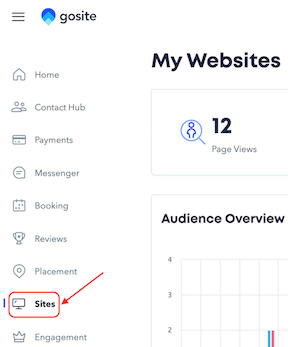
Start by logging in to GoSite. Click on the "Sites" tool on the left-hand side of the dashboard to pull up the "My Websites" page.
Note: Website insights can only be viewed on a desktop computer. This is not currently a function on the mobile app for Iphone, Android or Tablets.
Page Views, Total Sessions, and Avg. Session Duration
The three numbers at the top of the "My Websites" page shows data for the last 30 days of your website's page views, total sessions, and average session durations.
Here's what each means:
-
Page Views: the total number of times your website has been loaded by a viewer
-
Total Sessions: the total number of times a viewer has spent 30 seconds or more on your website
-
Avg Session Duration: the average number of seconds a viewer spends on your website
 Audience Overview
The graph in the "Audience Overview" section shows a monthly breakdown of your website's sessions, bounces, and page views. You can also change to Weekly or Yearly views by clicking the arrow on the right-hand side next to "Monthly."
Here's what each means:
-
Sessions (purple line): the total number of times a viewer has spent 30 seconds or more on your website
-
Bounces (blue line): the total number of times your website was opened and the viewer took no action or didn't click any links before it was closed
-
Page Views (pink line): the total number of times your website has been loaded by a viewer (one session can generate more than one page view)

Note: If you hover your mouse over a line on the graph, a pop-up will show the exact number of sessions, bounces, and page views for that day.
Still need help?
Visit us at gosite.com to chat, or email us at help@gosite.com.